
Account
| | Astronomical FFT processing systemGraphical User Interface Manual |

Introduction
The AstroGui application provides the user a means to control the data aquisition and logging parameters of a BEAM astroFFT processing system.System Architecture
The AtroFFT system is designed to operate in a networked environment. Capture and initial processing of signals is performed on a single machine on the network. Control of the aquisition may be performed from the actual capture machine or other specified machine on the network.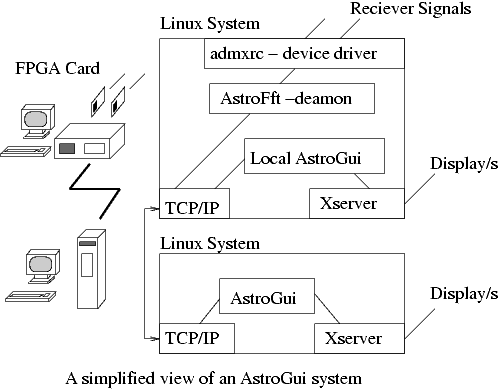
Invoking the application
If AstroGui is to be run on the aquiring machine simply invoke the command :-(Note: It is assumed that the tcp services astrofft and astrofftdata have been configured.)
The optional argument hostname indicates the machine on which the aquisition deamon process astroFft is runnning. By default it is assumed to be the local machine. For a remote login on a machine running X the command would specify the name of the remote machine :-astrogui [hostname]
astrogui -display [remote machine]:0
The main window of the application is shown below: -
Viewed vertically the window has a number of distinct sections :-
- A main menu bar, File; View ;Help.
- A tool bar
- Parameter setup options and controls
- A Graph area containing two graphs
- Scrolling status window.
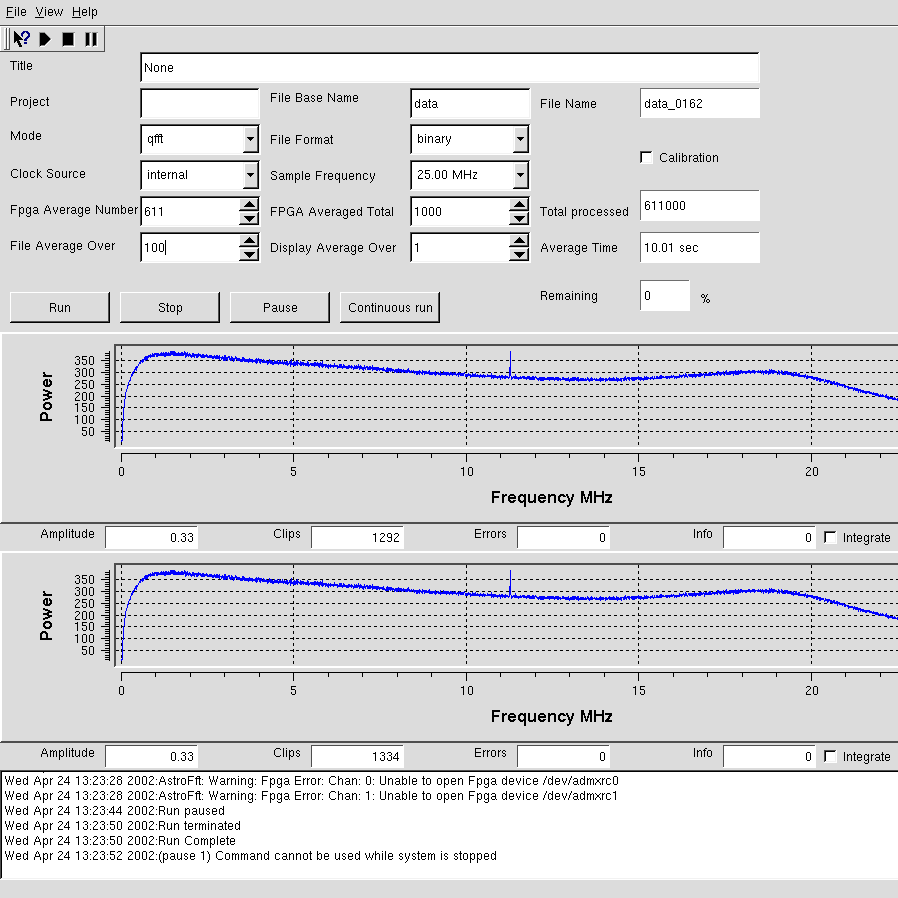
Title
Each run will generate a data file. Specify a title and the specifed string will be saved in the header information within the data file as :-Title:[TAB][title]
Project
The result data files are stored in a directory. This directory is specifiy by project. The directory may be on the local machine or assuming the nfs mounted directories remotely.Every time a new project is specifed a new directory will be created.
File Base Name
Each data file has the name format [File Base Name]_[run number]. A user may only specify the File Base Name portion, the run number being incremented by one for each run where project and File base name remain the same.
File Name
Information Only. Displays the name of the target data file during a run.
Mode
The operational mode of the FFT capture. In fft mode the input data is processed by an fft algorithm. The resulting frequency spectrum is displayed in the graphs (and stored in the data files). In analogue mode the input is sampled and the A/D magnitude displayed on the graph. In analogue mode, two plots are made on a graph, one for each of the two A/D sampling channels. Analogue mode is provided primarily for diagnostic purposes.
File Format
The data file may be saved in either ASCII or Binary Formats.Details of the file format can be found in the Software Interface Specification
Calibration
When calibration is tick'd records saved in the data file are tagged to indicate a calibration was in progress. This option has no other effect.
Clock Source
Selects the FPGA clock source. The two supported options are,Internal and External.
Sample Frequency
Selects the sampling frequency of the ADC converter..
Fpga Average Number
The FPGA performs an FFT on the sampled data. The FPGA can average a number of these FFTs. Enter the number of FFTs to be averaged within the FPGA.
FPGA Averaged Total
Specify the number of averaged FFTs to perform during a single run. The actual number of FFTs performed is :-[total number] * [ FPGA average number ].
In the case of analogue mode FPGA average number has no effect, and the number of samples is [total number]*Samples per block. Samples per block = 4096
File Average Over
Each data record in the data file is a further average of the already FPGA averaged FFTs. A small number can produce very large data files.
Display Average Over
The runtime graphs may be updated during a run. The display average over parameter specifies this update rate.
Average Time
Displays the average run duration in seconds.
Remaining
Displays the percentage of data remaining to be collected during the current run.
Run
Start a run with the specified parameters.
Stop
Stop the current run
Pause
Pause the current run. Data placement into the data file will stop, however the real time display will continue to update.
Continuous run
Performs continuous runing. Once one run has been completed another will follow. The filename is automatically updated.
Graphs
The graphs display snapshots of the captured data. The update interval during a run is set by the Display average over parameter. Clicking on the Integrate tick box will, when in fft mode,cause the graph to integrate all following input. Each graph has associated four 'information' boxes:Amplitude
The RMS value of the dataClips
The number of times the data clipped.Errors
The number of errors.Info
Info bits.
The Status Window
This scrolling window is used to print out information regarding the status of the system.